Insights
CAPE: Fear or Good Hope? Part 1
The indicator sounding the alarm at the top of the market is one of the perennial favourites of the investment media: The Shiller CAPE ratio.
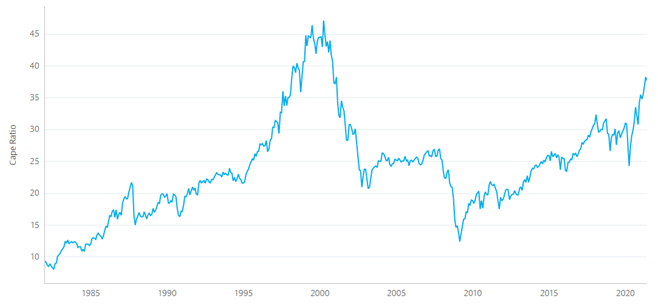
Figure 1: The Shiller CAPE ratio 31 December 1981–31 May 2021 (Source: indices.Barclays)
It is easy copy (often regurgitating earlier articles), nicely sensationalist and an arresting counterpoint in a bull market. Gratifyingly, at least for the journalists, it usually results in a flood of calls to investment advisers and managers from worried clients seeking reassurance that the walls of their portfolios are not about to come tumbling down. And on top of all this, at some point, one of the articles will be right, will call the top of the market and will make the reputation of the journalist involved (along with any experts he or she may have quoted in support).
Although something of a cross to bear for those of us who look after clients, the sensationalist nature of the articles can also act to obscure some genuine wisdom hidden in the indicators’ messages, which is a shame for everybody concerned. With this in mind, I thought, for the latest IAM Investment Insight, I might take a look at the Shiller CAPE (cyclically adjusted price-to-earnings) ratio, an indicator that has attracted a lot of comment recently for reaching levels last seen at the time of the dot com bubble, 20 years or so ago.
And, at the risk of being a little sensationalist myself (it’s actually quite hard to resist!), most of us will remember how it turned out on that occasion.
To start then, with some definitions. Quoting Wikipedia, the Shiller CAPE can be defined as “a valuation measure usually applied to the US S&P 500 equity market. It is defined as price divided by the average of ten years of earnings (moving average) adjusted for inflation”. So it is a species of Price/Earnings ratios but different from the more conventional measures chiefly in that it uses a long-term average of earnings rather than current earnings, or those as forecast by analysts, as its denominator. The idea is that it thus smooths out the short-term volatility, or the normal ‘noise’, in company earnings, as well as the medium-term volatility caused by the business cycle, to give a better measure of the underlying trend in the market’s real earnings whilst, at the same time, establishing how fairly valued the market is on a long-term view.
The ratio was proposed by Nobel laureate, Robert Shiller*, and John Campbell in a 1988 paper^. The two calculated the CAPE all the way back to 1881 and concluded that the lower the ratio, the higher investors’ returns from equities over the following 20 years (my emphasis). Looking through the data (all available on http://www.econ.yale.edu/~shiller/ along with a treasure trove of other material), I was struck, in particular, by:
• the low average level of the ratio over the whole period – 17.16 – compared to its level in recent times. Indeed, you have to go all the way back to January 1991 to find the last month the CAPE ratio was below its historic average; and
• quite how ‘over-extended’ the ratio looks currently at just over 37. There are only 3 periods when the ratio has breached 30: briefly in August and September 1929, between June 1997 and March 2002, and since September 2017 (though in the latter 2 periods there were occasions when the ratio dipped back below the 30 level before regaining it, for example, in September and October 2001).
The observations lead me to ask whether there has been a fundamental change in the market, or the method of calculation, such that higher levels of the CAPE are now justified? and, notwithstanding the answer, should we be worried at a CAPE that currently stands at over 37? I will try and answer both these questions in Part 2.
* My favourite, and rather barbed, remark about Robert Shiller is that he is ‘the only man to call 9 out of the last 3 stock market crashes’, which helps explain his Dr Doom, soubriquet.
^ Campbell, John Y & Shiller, Robert J 1988, ‘Stock Prices, Earnings and Expected Dividends’, The Journal of Finance, Vol. 43, No. 3, pp. 661-676